R/viz.R
plot_usage.Rd
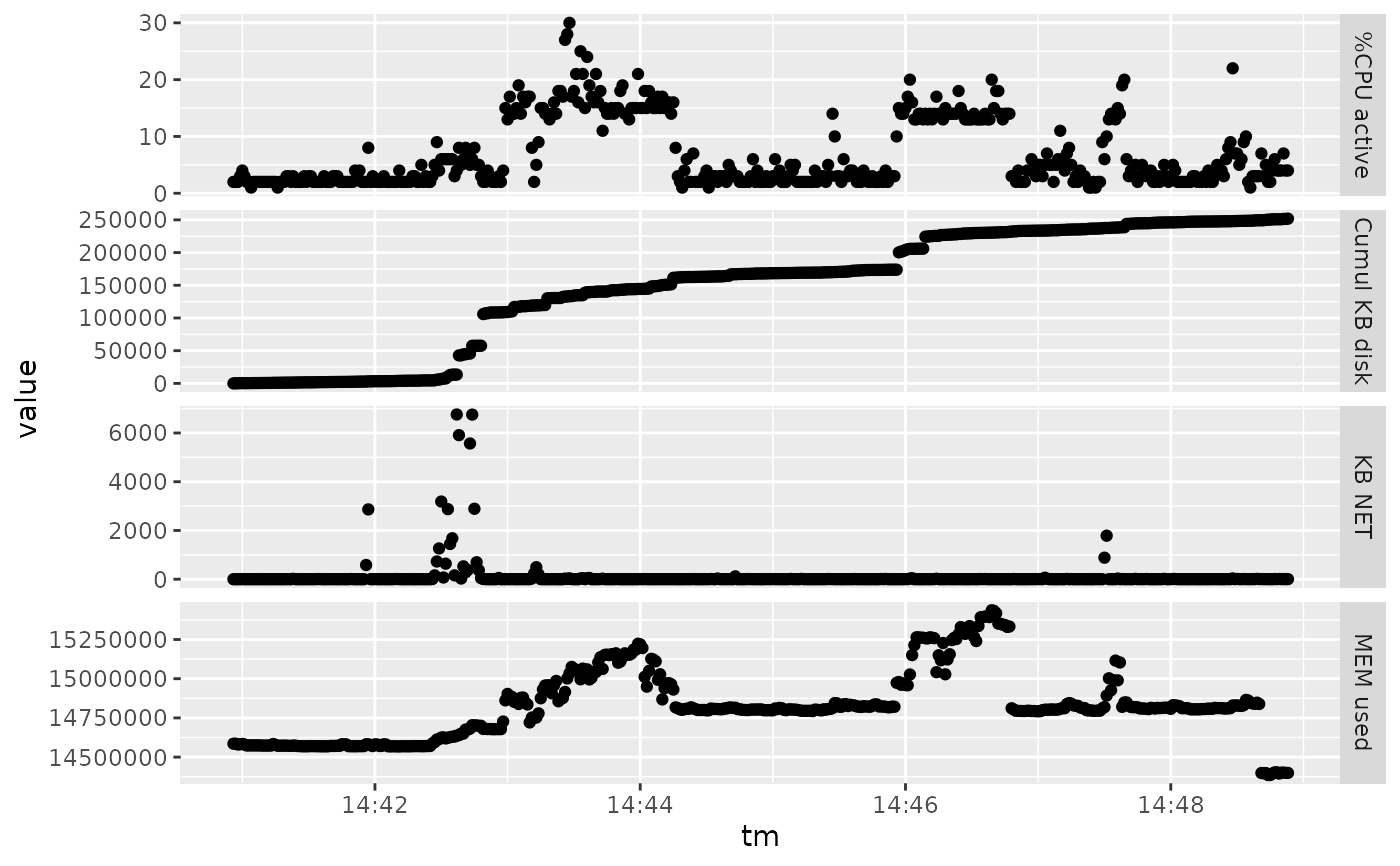
elementary display of usage data from collectl
plot_usage(x)
output of cl_parse
ggplot with geom_point and facet_grid
lk = cl_parse(system.file("demotab/demo_1123.tab.gz", package="Rcollectl"))
plot_usage(lk)