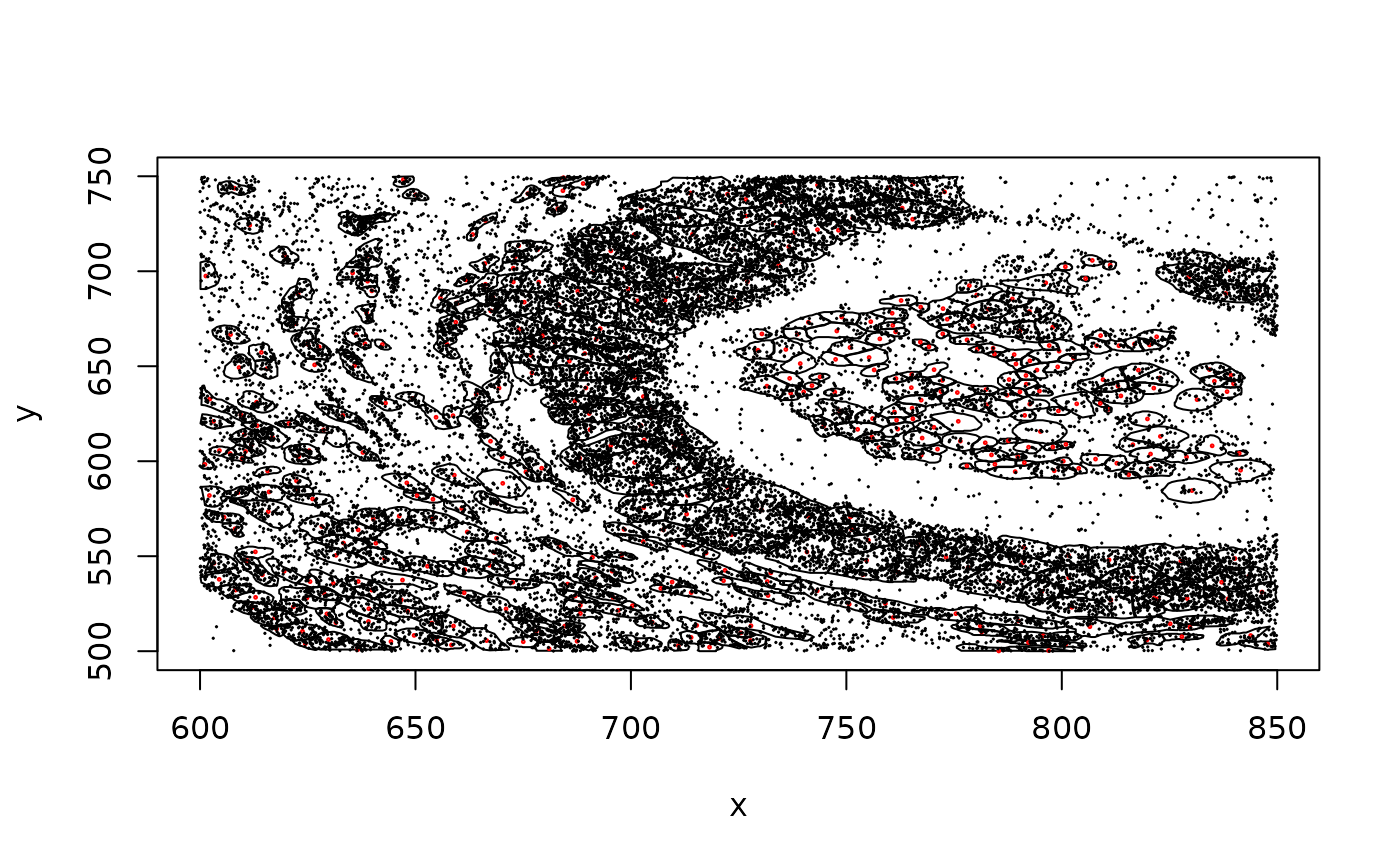
render boundaries of cells with optional centroid positions and transcript positions
Source:R/plotCellBoundaries.R
plotCellBoundaries.Rdrender boundaries of cells with optional centroid positions and transcript positions
plotCellBoundaries(
  xsce,
  add_cent = TRUE,
  cent_col = "red",
  cent_cex = 0.2,
  add_tx = TRUE,
  tx_cex = 0.1
)
Arguments
Examples
dem = build_panc_subset()
plotCellBoundaries(clip_rect(dem, xlim=c(600,850), ylim=c(500,750)))