set up a data.frame for barplot visualization for a gene
simba_barplot_df(sce, genesym, colvars = "celltype")Arguments
- sce
SingleCellExperiment with altExp element "sprobs"
- genesym
character(1)
- colvars
character() columns from colData(sce) to propagate
Value
data.frame with elements rank, prob, and propagated columns
Examples
data(nn50)
data(t3k)
t3k = add_simba_scores(nn50, t3k)
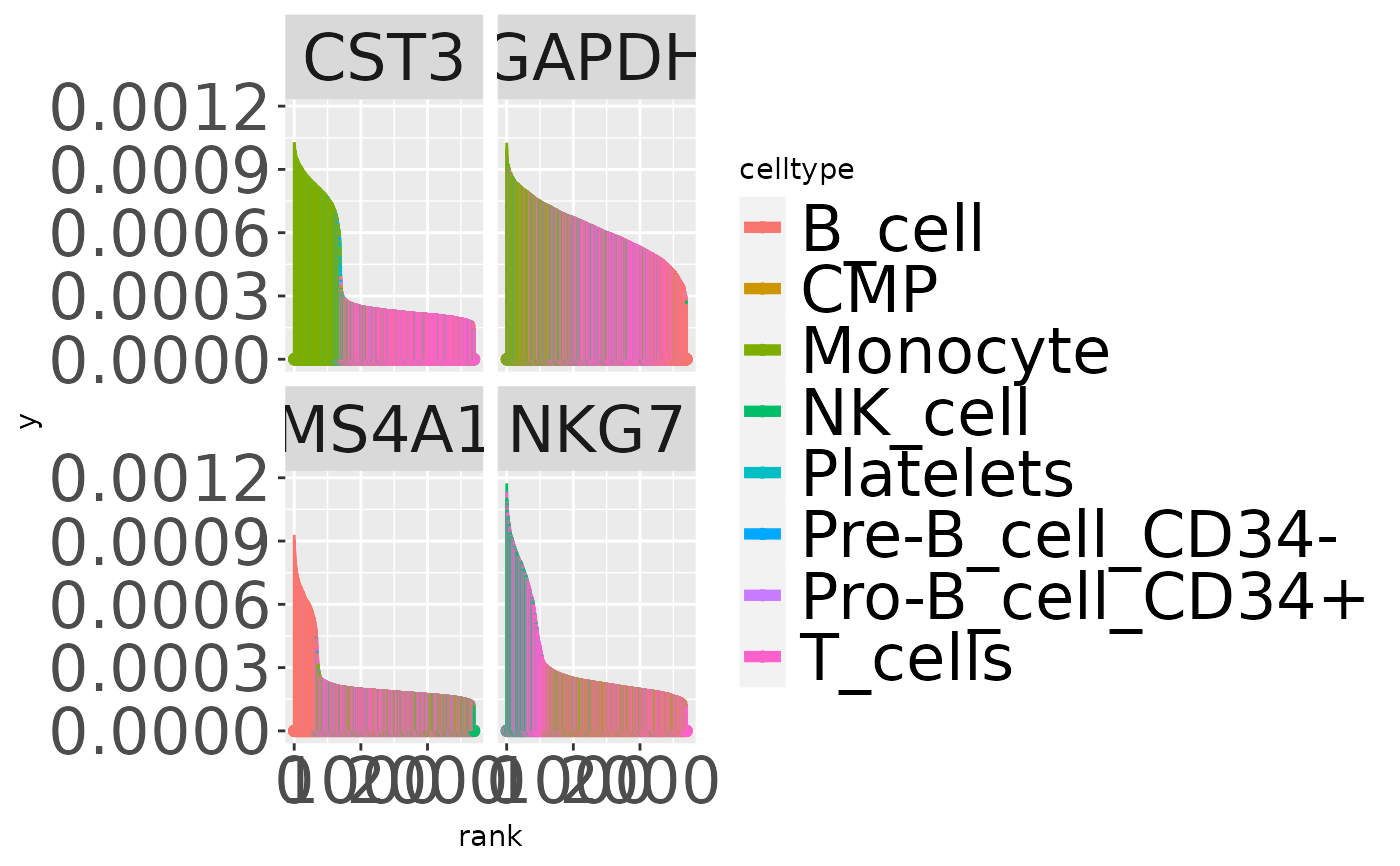
gns = c("CST3", "MS4A1", "NKG7", "GAPDH")
alldf = lapply(gns, function(x) simba_barplot_df(t3k, x,
colvars = "celltype"))
alldf = do.call(rbind, alldf)
ggplot(alldf, aes(x=rank,xend=rank,y=0, yend=prob,colour=celltype)) + geom_point() +
geom_segment() + facet_wrap(~symbol, ncol=2) +
theme(strip.text=element_text(size=24),
legend.text=element_text(size=24),
axis.text=element_text(size=24)) +
guides(colour = guide_legend(override.aes =
list(linetype=1, lwd=2)))