Introduction
This document is written in markdown for processing with quarto.
Using R/Bioconductor to get the TENx PBMC 3k dataset
library(TENxPBMCData)
library(SingleCellExperiment)
p3k = TENxPBMCData("pbmc3k")
p3k
## class: SingleCellExperiment
## dim: 32738 2700
## metadata(0):
## assays(1): counts
## rownames(32738): ENSG00000243485 ENSG00000237613 ... ENSG00000215616
## ENSG00000215611
## rowData names(3): ENSEMBL_ID Symbol_TENx Symbol
## colnames: NULL
## colData names(11): Sample Barcode ... Individual Date_published
## reducedDimNames(0):
## mainExpName: NULL
## altExpNames(0):## [1] "DelayedMatrix"
## attr(,"package")
## [1] "DelayedArray"Bioconductor ‘SingleR’ workflow for reference-based labeling
Start with the single-cell expression data for 2700 PBMCs. Raw counts are normalized and log-transformed, see scuttle::normalizeCounts.
assay(p3k) = as.matrix(assay(p3k)) # make dense
p3k = scuttle::logNormCounts(p3k)
p3k
## class: SingleCellExperiment
## dim: 32738 2700
## metadata(0):
## assays(2): counts logcounts
## rownames(32738): ENSG00000243485 ENSG00000237613 ... ENSG00000215616
## ENSG00000215611
## rowData names(3): ENSEMBL_ID Symbol_TENx Symbol
## colnames: NULL
## colData names(12): Sample Barcode ... Date_published sizeFactor
## reducedDimNames(0):
## mainExpName: NULL
## altExpNames(0):Develop a provisional labeling with SingleR.
Here we use HumanPrimaryCellAtlas “fine-grained” labeling.
library(SingleR)
library(celldex)
hpca = celldex::HumanPrimaryCellAtlasData()
inirown = rownames(p3k)
rownames(p3k) = make.names(rowData(p3k)$Symbol, unique=TRUE)
ann2 = SingleR(p3k, hpca, labels=hpca$label.fine)
library(scater)
p3kp = runPCA(p3k)
pairs(reducedDims(p3kp)$PCA[,1:4],
  col=factor(ann2$labels), pch=19, cex=.3)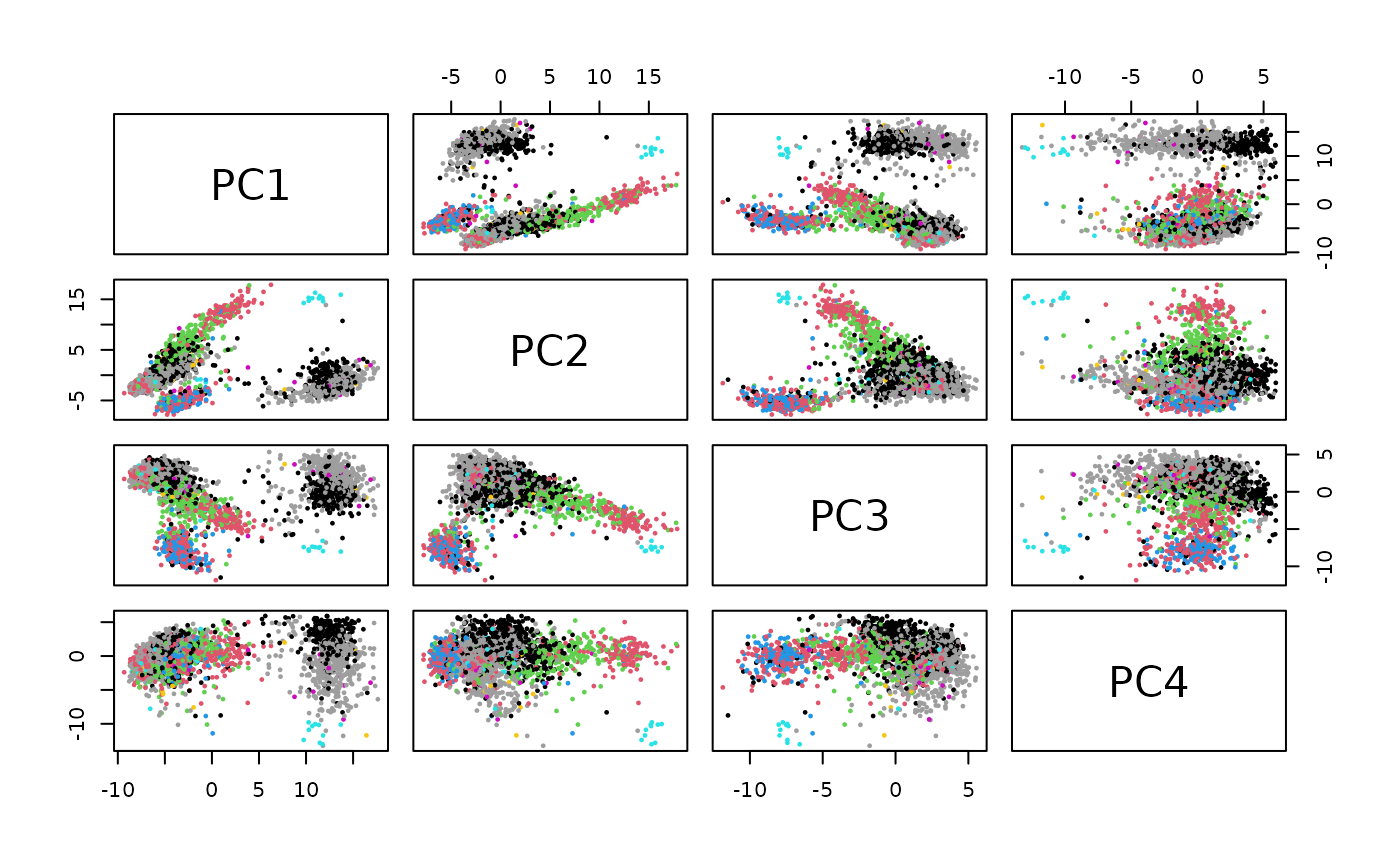
rownames(p3k) = inirownInteractive visualization
df23 = data.frame(reducedDims(p3kp)$PCA[,1:4], type=ann2$labels)
library(ggplot2)
p23 = ggplot(df23, aes(PC3, PC2, color=type)) + geom_point()
library(plotly)
ggplotly(p23)