compute Z-statistics for xQTL association and bind them to the input x-ome+genome XqtlExperiment
Source:R/bind_Zs.R
bind_Zs.Rdcompute Z-statistics for xQTL association and bind them to the input x-ome+genome XqtlExperiment
Usage
bind_Zs(xse, omit.hi.maf = FALSE, BPPARAM = BiocParallel::bpparam())Examples
data(geuv19xse)
lk = geuv19xse[1:20,]
mafs = maf(lk) # only snps here
mins = apply(data.matrix(mcols(getCalls(lk))), 1, min, na.rm=TRUE) # some -1 values
#filterCalls = function(xse, keep) { slot(xse, "calls") = slot(xse, "calls")[keep,]; xse }
lk = filterCalls(lk, which(mafs>.25 & mins > -1))
lk = bind_Zs(lk)
#> some variants have MAF > 0.5
head(rowRanges(lk)[,7])
#> GRanges object with 6 ranges and 1 metadata column:
#> seqnames ranges strand | snp_19_1400679
#> <Rle> <IRanges> <Rle> | <numeric>
#> ENST00000545779 18 15254418-15271744 + | 0.0361026
#> ENST00000408051 19 71973-72110 + | NaN
#> ENST00000318050 19 110643-111696 + | 1.1910512
#> ENST00000410397 19 223158-223261 - | NaN
#> ENST00000327790 19 281040-291185 - | 1.0622605
#> ENST00000434325 19 281040-291504 - | 0.2106134
#> -------
#> seqinfo: 319 sequences (1 circular) from GRCh38 genome
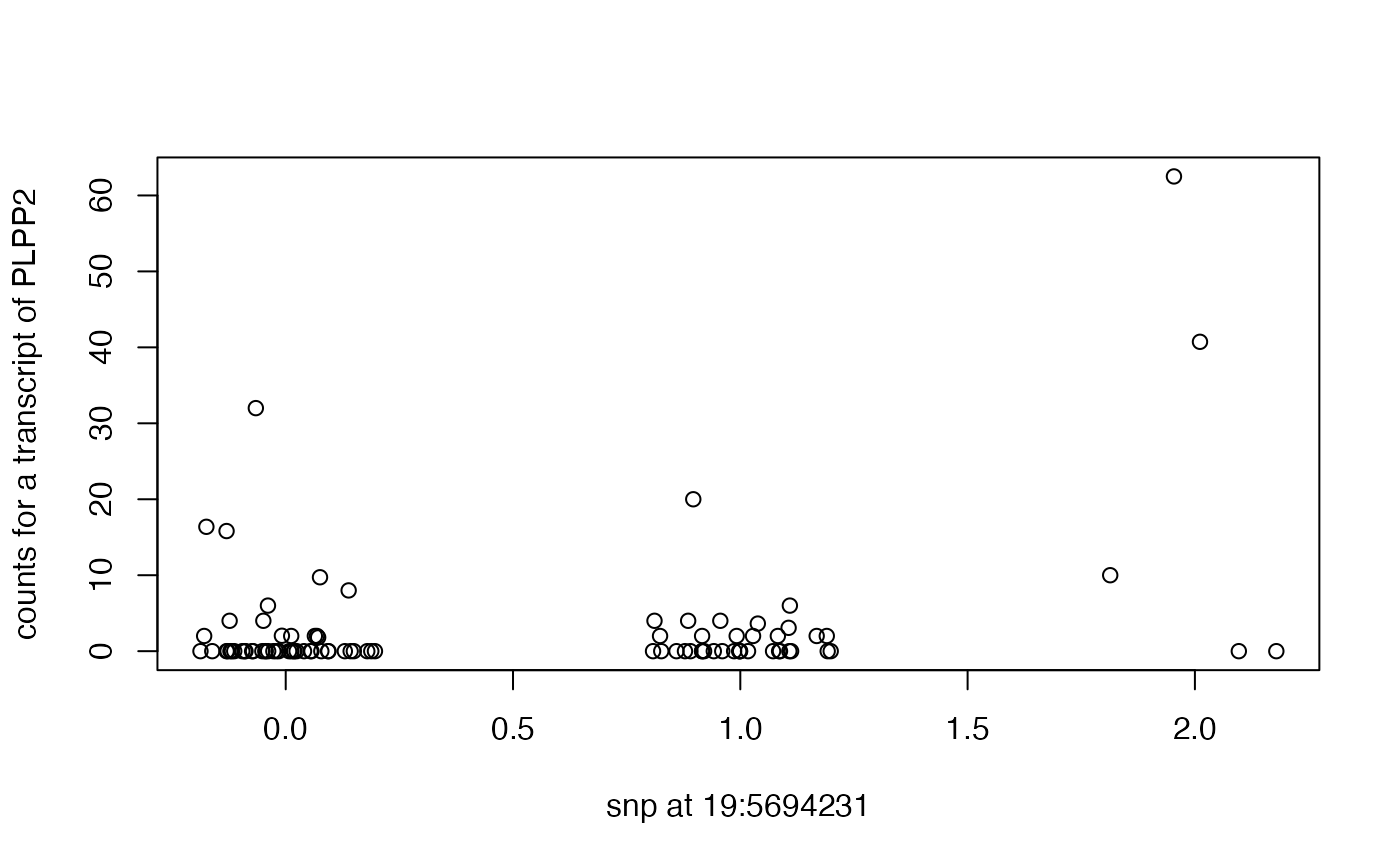
plpp2tx = as.numeric(assay(lk["ENST00000434325",]))
hiz = as.numeric(data.matrix(mcols(getCalls(lk))["snp_19_5694231",]))
plot(plpp2tx~jitter(hiz), xlab="snp at 19:5694231", ylab="counts for a transcript of PLPP2")
 summary(lm(plpp2tx~hiz))
#>
#> Call:
#> lm(formula = plpp2tx ~ hiz)
#>
#> Residuals:
#> Min 1Q Median 3Q Max
#> -9.636 -5.245 -0.854 -0.854 52.868
#>
#> Coefficients:
#> Estimate Std. Error t value Pr(>|t|)
#> (Intercept) 0.8542 1.1717 0.729 0.46790
#> hiz 4.3908 1.4936 2.940 0.00418 **
#> ---
#> Signif. codes: 0 '***' 0.001 '**' 0.01 '*' 0.05 '.' 0.1 ' ' 1
#>
#> Residual standard error: 8.547 on 89 degrees of freedom
#> Multiple R-squared: 0.08851, Adjusted R-squared: 0.07827
#> F-statistic: 8.642 on 1 and 89 DF, p-value: 0.004184
#>
summary(lm(plpp2tx~hiz))
#>
#> Call:
#> lm(formula = plpp2tx ~ hiz)
#>
#> Residuals:
#> Min 1Q Median 3Q Max
#> -9.636 -5.245 -0.854 -0.854 52.868
#>
#> Coefficients:
#> Estimate Std. Error t value Pr(>|t|)
#> (Intercept) 0.8542 1.1717 0.729 0.46790
#> hiz 4.3908 1.4936 2.940 0.00418 **
#> ---
#> Signif. codes: 0 '***' 0.001 '**' 0.01 '*' 0.05 '.' 0.1 ' ' 1
#>
#> Residual standard error: 8.547 on 89 degrees of freedom
#> Multiple R-squared: 0.08851, Adjusted R-squared: 0.07827
#> F-statistic: 8.642 on 1 and 89 DF, p-value: 0.004184
#>