produce a manhattan plot for a given study, based on specific coordinates or gene symbol with radius for flanking region
Source:R/manh.R
manhattanPlot.Rdproduce a manhattan plot for a given study, based on specific coordinates or gene symbol with radius for flanking region
manhattanPlot(
  studyID = "ubm-a-524",
  symbol = "BCAN",
  start = NULL,
  stop = NULL,
  chromosome = NULL,
  radius = 0,
  datasource = gwidf_2021_01_30
)
Arguments
- studyID
character(1) id of study in ieugwasr::gwasinfo() catalog, defaults to "ubm-a-524", which is a study described in Elliott et al Nature October 2018
- symbol
a gene symbol (to be used with
genesym_to_string, implicitly); if absent, chromosome, start and end must be supplied, defaults to 'BCAN'- start
chromosomal address to start region (will have radius subtracted if supplied)
- stop
chromosomal address to end region (will have radius added if supplied)
- chromosome
name of chromosome in Ensembl nomenclature (e.g., 1, 2, ...)
- radius
numeric default to zero, specifies flanking region
- datasource
data.frame that includes study identifier
idandtraitfor labeling
Note
Includes text component of aes() so that ggplotly can be used for hovering over SNP to reveal rsid.
Examples
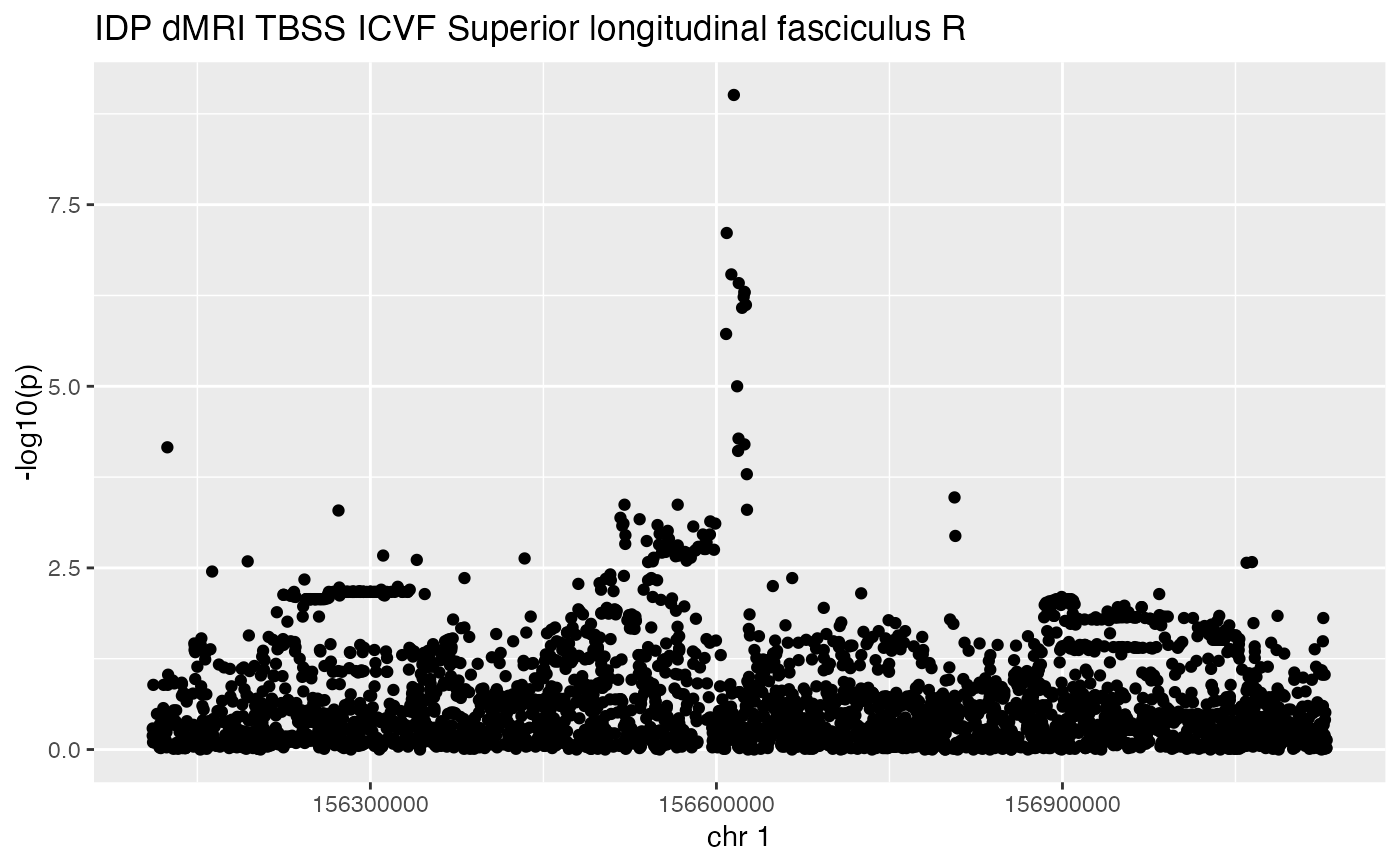
# ubm-a-524 is a study of an image-derived phenotype in UK Biobank,
# specifically 'dMRI TBSS ICVF Superior longitudinal fasciculus'
# see https://dx.doi.org/10.1038%2Fs41586-018-0571-7
manhattanPlot(studyID = "ubm-a-524", symbol = "BCAN", radius=500000)
#> # A tibble: 6 × 12
#> chr p beta posit…¹ n se id rsid ea nea eaf trait
#> <chr> <dbl> <dbl> <int> <dbl> <dbl> <chr> <chr> <chr> <chr> <dbl> <chr>
#> 1 1 0.794 0.0041 1.56e8 7916 0.0165 ubm-… rs11… T G 0.654 IDP …
#> 2 1 0.692 0.0199 1.56e8 7916 0.0508 ubm-… rs12… A G 0.0244 IDP …
#> 3 1 0.692 0.0078 1.56e8 7916 0.0197 ubm-… rs72… T C 0.199 IDP …
#> 4 1 0.447 0.0125 1.56e8 7916 0.0163 ubm-… rs72… T G 0.350 IDP …
#> 5 1 0.501 -0.081 1.56e8 7916 0.120 ubm-… rs57… A G 0.00500 IDP …
#> 6 1 0.302 0.0167 1.56e8 7916 0.0161 ubm-… rs46… T C 0.362 IDP …
#> # … with abbreviated variable name ¹position