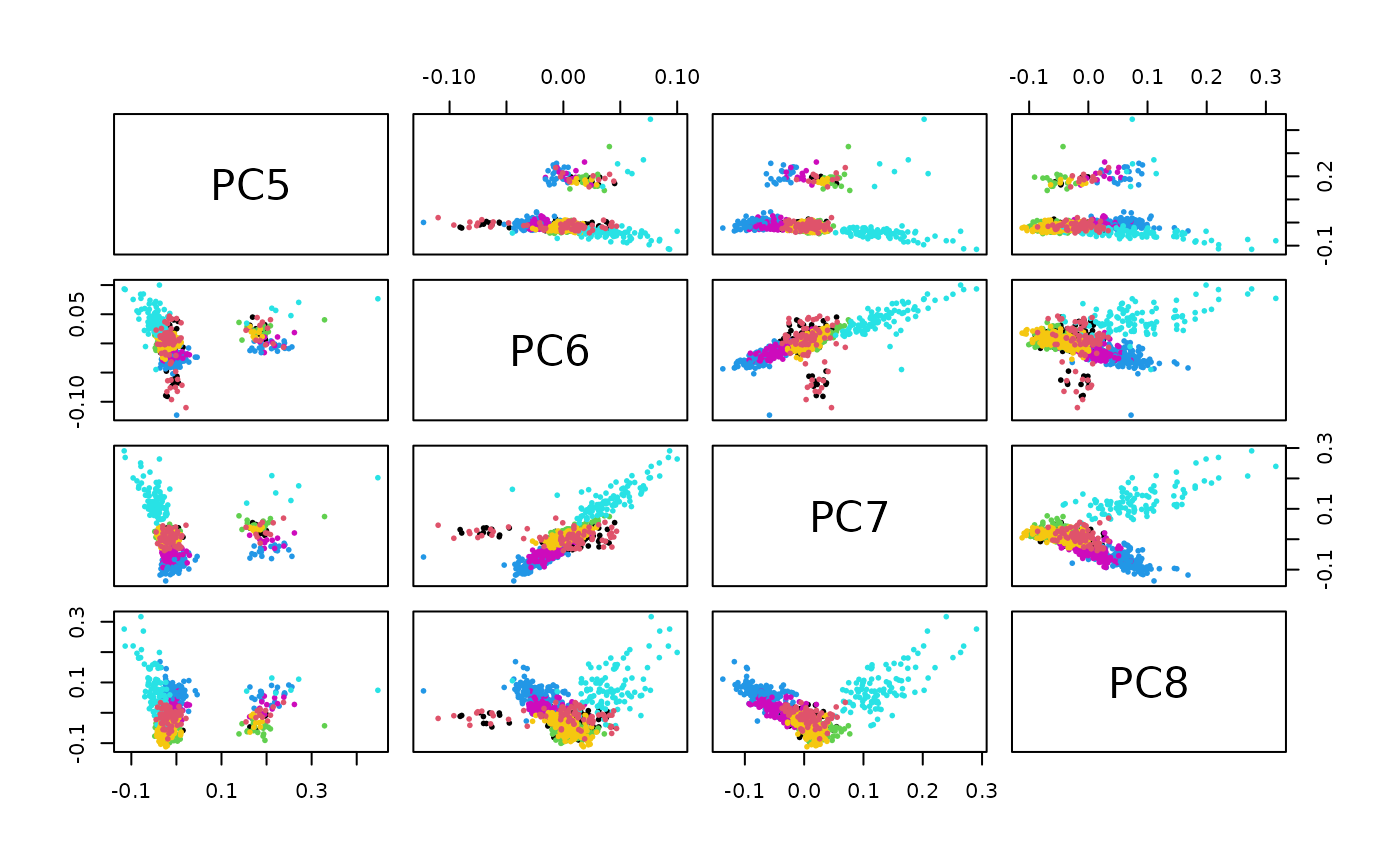
static visualization of PCA pairs
strat2d.Rdstatic visualization of PCA pairs
strat2d(
  pcmat,
  pcinds = 5:8,
  superpop = "AFR",
  GGally = FALSE,
  superOnly = FALSE
)
Arguments
- pcmat
matrix with columns PC1...PCn
- pcinds
numeric vector with suffixes from colnames(pcmat) to select for visualization
- superpop
character(1) three letter superpopulation code, see `data(igsr_pops)`
- GGally
logical(1) if TRUE, use `GGally::ggpairs` to visualize, otherwise `pairs()`
- superOnly
logical(1) defaults to FALSE; if TRUE, do not limit to one superpopulation
Value
Side effects of plotting with either `pairs` or `GGally`
Examples
data(pc_190kloci)
strat2d(pc_190kloci)
