C3 Molecular origins of diverse cancers
Vincent J. Carey, stvjc at channing.harvard.edu
October 30, 2024
Source:vignettes/C3_subtypes_molecular.Rmd
C3_subtypes_molecular.RmdMolecular origins of tumors and their spread
In this segment we will review basic definitions underlying the use of data to understand variation in genetic processes connnected with initiation and progression of cancer.
Human genome
The human genome is composed of 22 autosomal chromosome pairs and 1 pair of sex chromosomes. Autosomal chromosomes are numbered 1-22; females have a pair of X chromosomes, and males have a pair labeled X and Y.
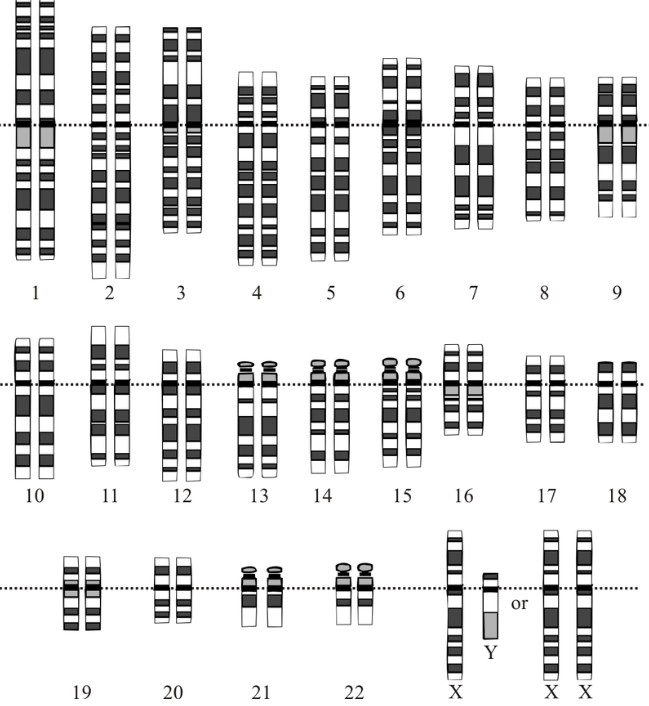
Genome overview
Central dogma
“DNA makes RNA makes protein”
The genetic material from which chromosomes are formed is DNA (deoxyribonucleic acid).
DNA is transcribed to RNA (ribonucleic acid)
RNA is translated to protein.
A schematic from Wikipedia, by Adenosine
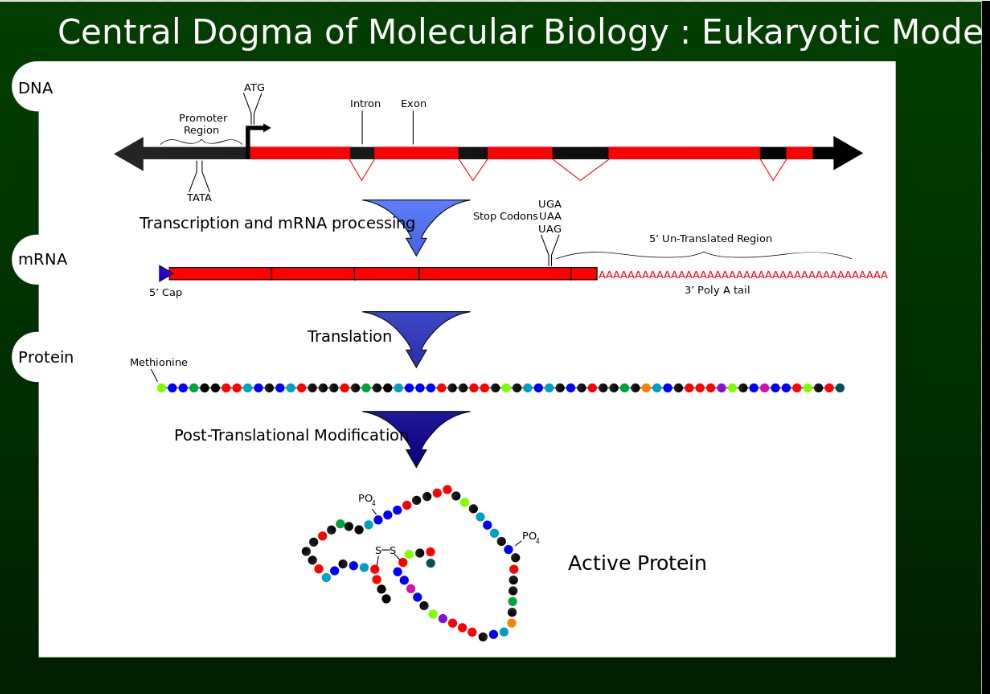
Central dogma
Gene counts by chromosome
“Gene” refers to a physical and functional component of the genome that is inherited between generations.
Gene finding and gene counting are basic tasks of bioinformatic analysis.
The sizes of chromosomes and numbers of genes currently known are depicted here:
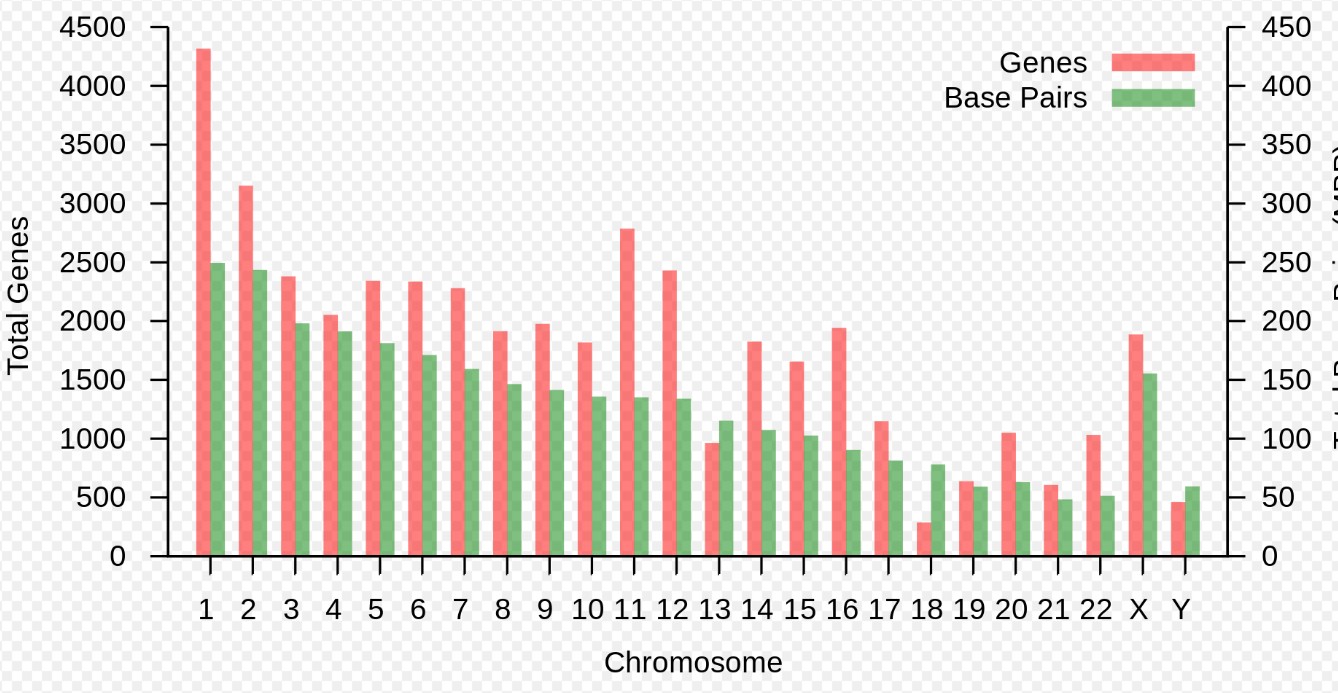
Gene counts
Browsing the reference genome
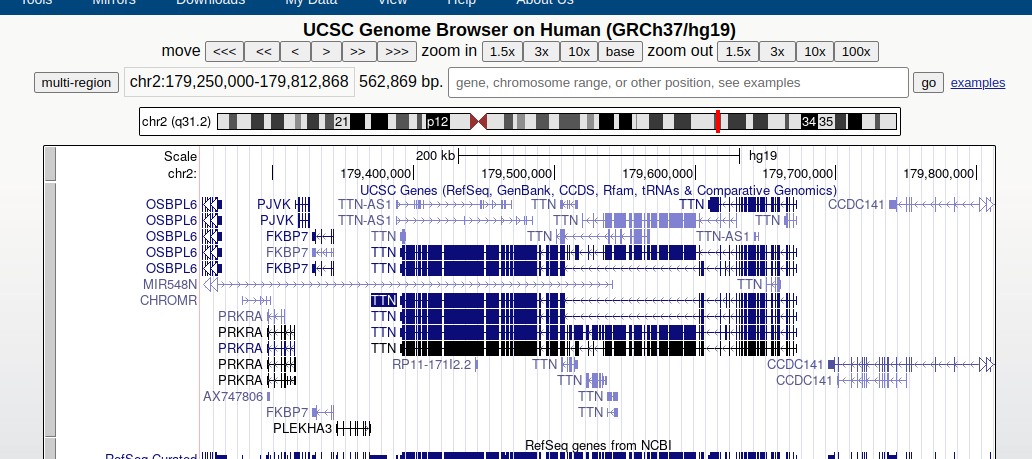
Visit the genome browser for the gene called TTN and you will see something like
browser
The display includes a karyogram (depiction of the entire chromosome) with a red patch indicating the portion of the chromosome being viewed. You can zoom out or in using the controls.
Each of the bands labeled TTN depicts a transcript of that gene. Distinct transcripts are formed as transcriptional machinery splices out different subsequences that we call introns. The transcript is a series of stitched-together exons.
Views of genomic variation in breast cancer
A 2012 view of the whole genome
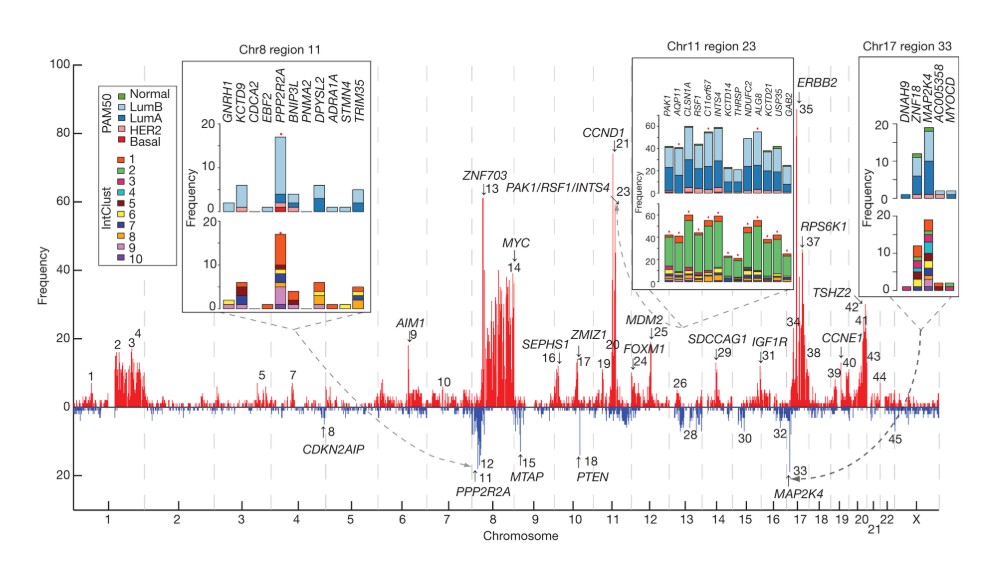
In this display, the chromosomes are ordered across the screen, from 1 to 22 followed by X.
Because this display concerns breast cancer in females, no Y chromosome is depicted.
The display is focused on “copy number alterations” (CNAs) in tumors – where (possibly large) segments of chromosomal DNA have been duplicated or deleted in the tumor. Red spikes denote positions where duplicating CNAs are associated with expression changes of nearby genes, blue spikes where a deleting CNA affects expression.
Genome-wide drivers
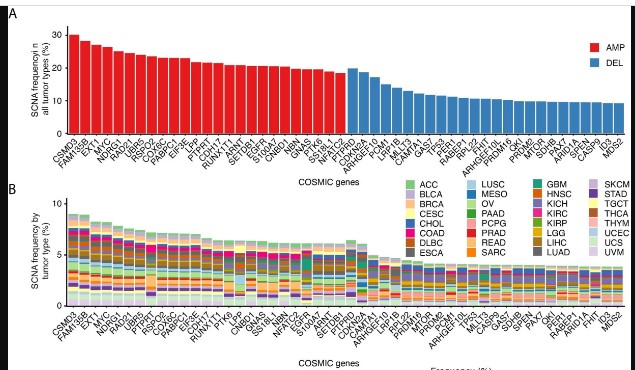
The figure above is drawn from a paper studying 2000 breast tumors. A more recent survey shows that the phenomenon pervades a broad spectrum of cancer types studied in The Cancer Genome Atlas (TCGA).
2021 CNA survey
TCGA: common mutations; TTN mutation and survival
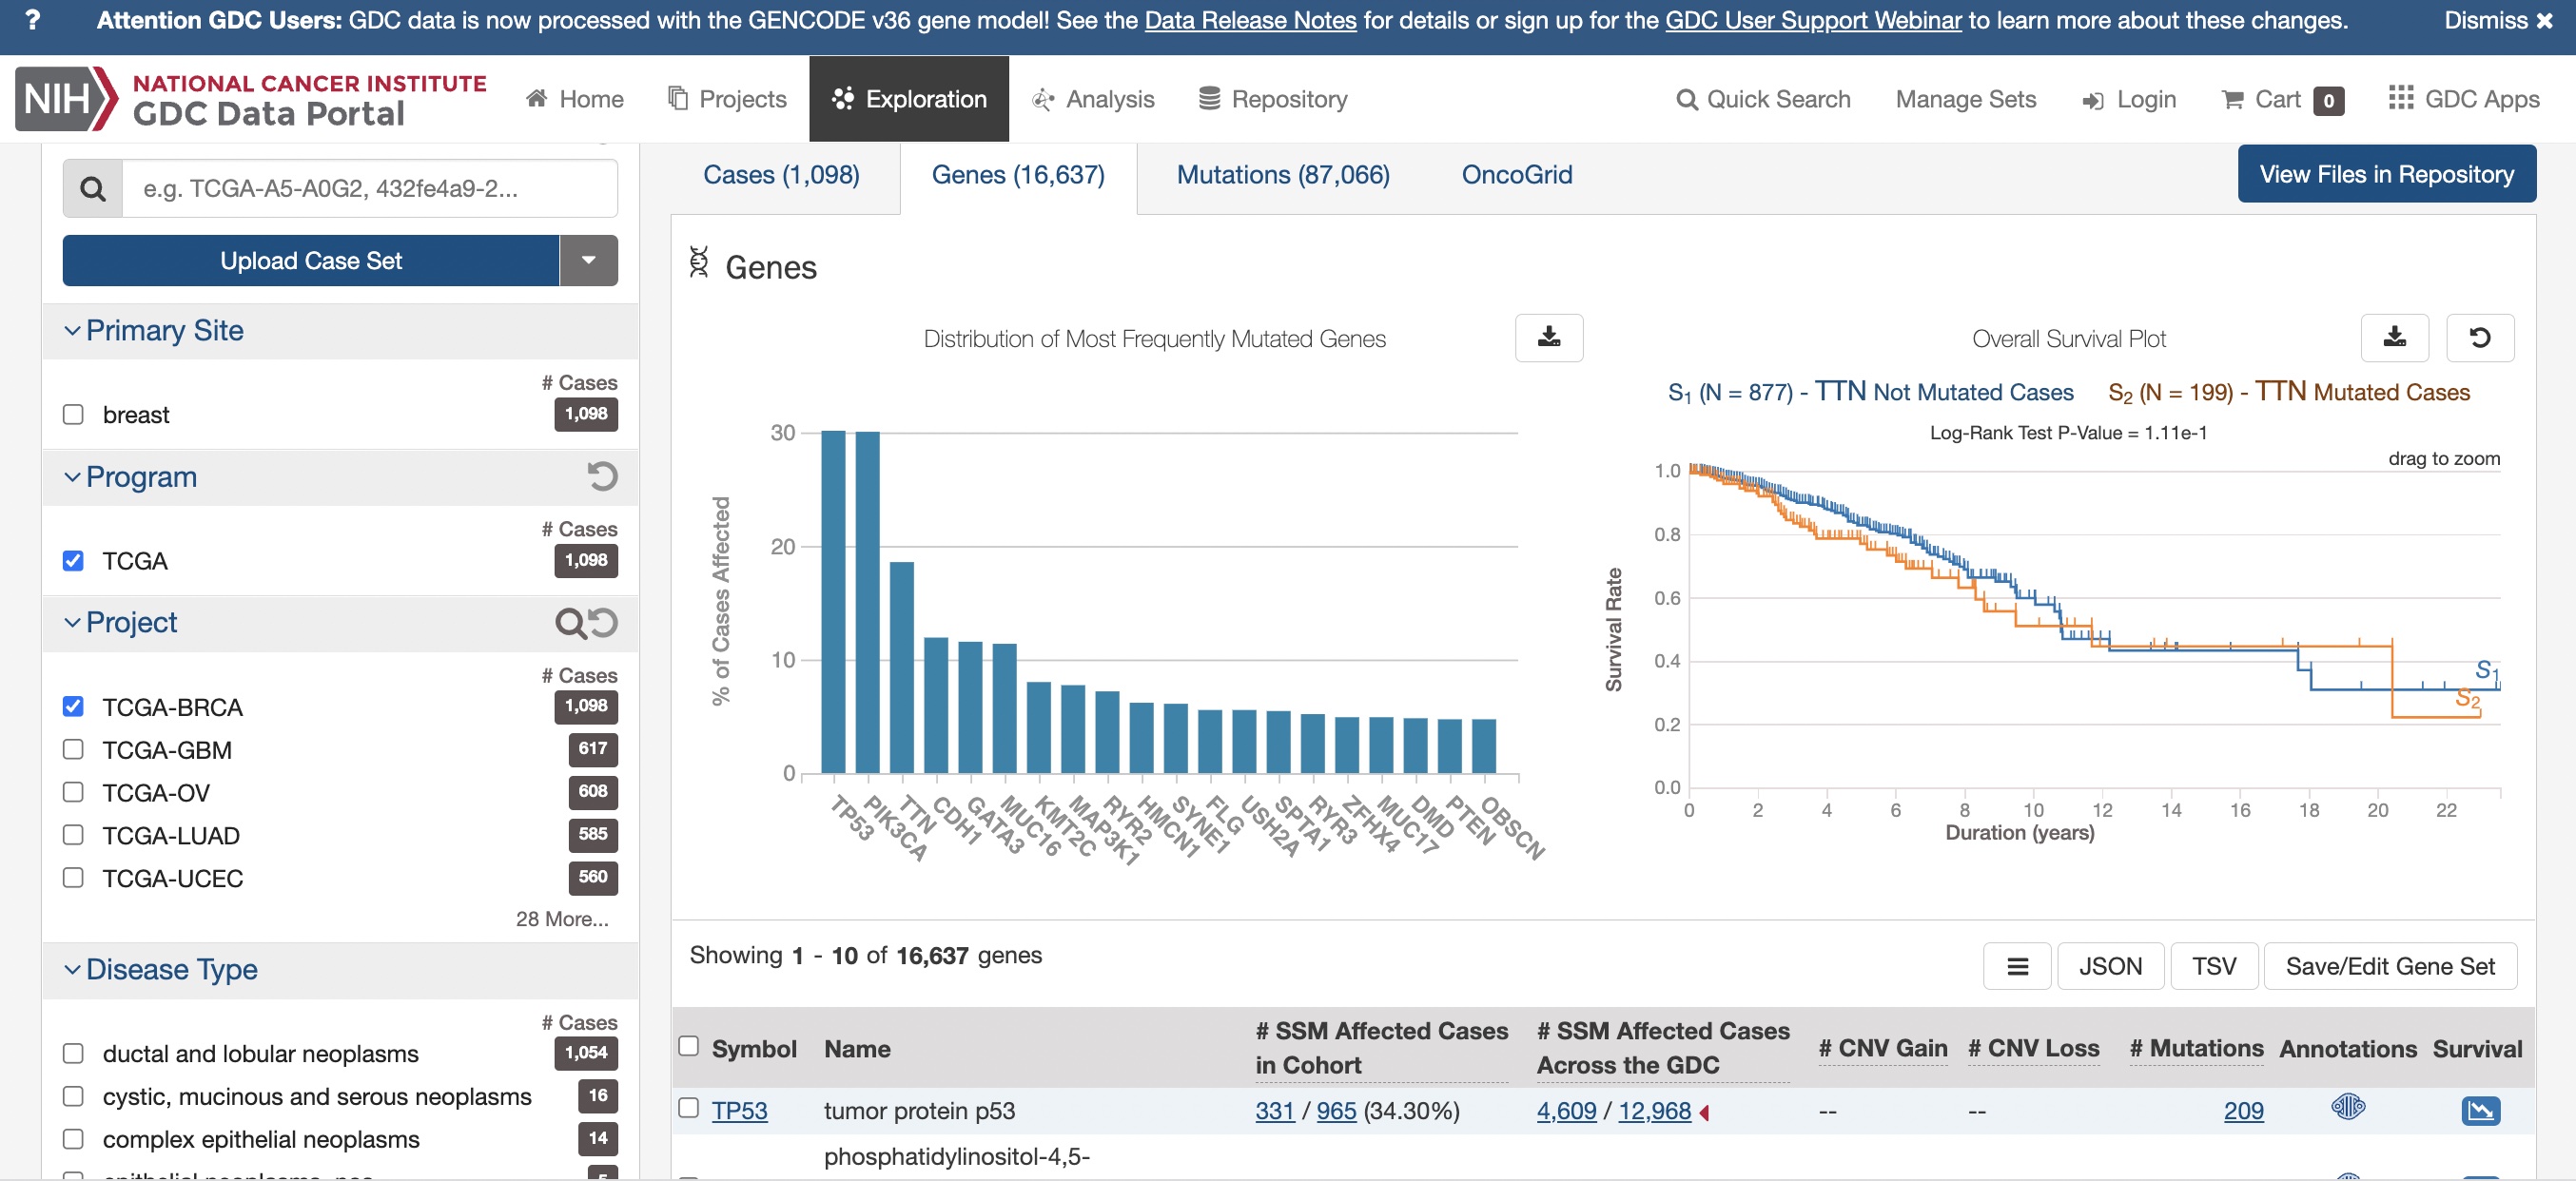
This display is from the NCI Genomic Data Commons:
Breast cancer summary
While the “titin” gene (TTN) is frequently mutated in TCGA breast cancer samples, and there is some indication that TTN mutations are disadvantageous for survival, the mechanism by which TTN may affect tumor progression is not understood.
The mutations seen in TTN may be “passenger” mutations with no functional significance.
The mutation “spectrum” is sometimes depicted using the oncogrid display.
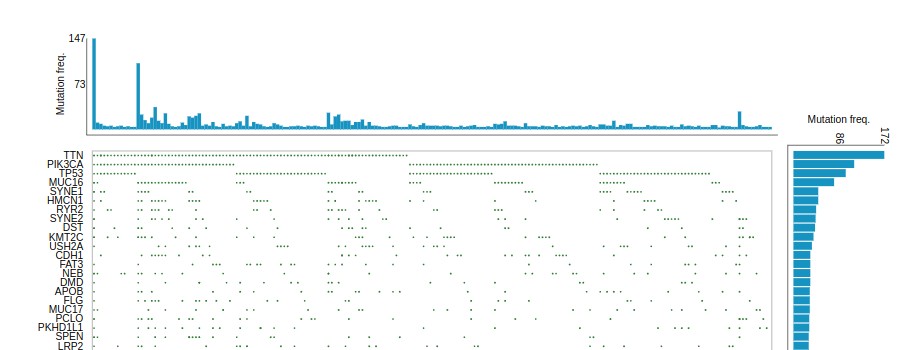
OncoGrid
Each column is a single tumor; each row a gene in which mutations were found for at least one of the patients. The overall interpretation is that there is striking diversity in the collection of mutated genes found for each patient.
Exercises
C.3.3 Use the Genomic Data Commons data portal to explore data on prostate cancer in the TCGA project. What are the five genes reported to present the largest number of mutations across patients in that project?
- Repeat the exercise for ovarian cancer in TCGA.
C.3.4 Use the “Survival” widget at the Genomic Data Commons to compare the survival times for ovarian cancer patients with and without mutation in CSMD3. Is CSMD3 mutation associated with longer or shorter median survival time? About how large is the difference?
Clustering mRNA profiles of genes and tumors to find subtypes: van ’t Veer et al. 2002
The following display summarizes about 500000 numbers (5000 genes by 98 tumors). Red patches are plotted for genes that are up-regulated (compared to adjacent normal tissue) in the associated tumor. Cluster trees are included to show the existence of groups genes that have similar expression across tumors, and groups of tumors that show similar expression across genes.
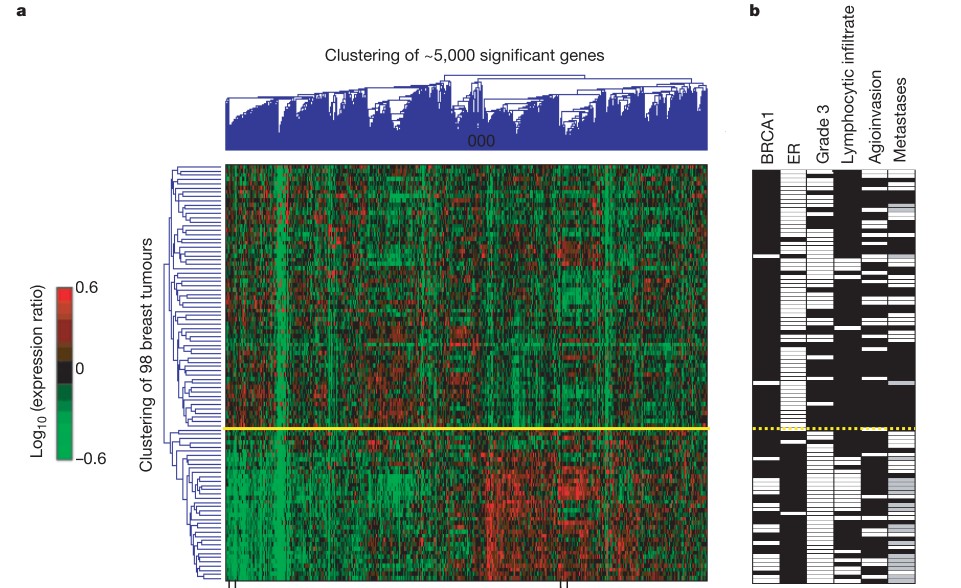
Classic heatmap
Evolution of tumor genome within a patient with metastatic breast cancer
Most of what we have covered so far pertains to molecular aspects of tissue taken from primary tumor samples.
After time, and especially after treatment has begun, tumor genomes can adapt to avoid treatment effects and resume division.
A 2021 paper from the Gabor Marth lab details the experience of one patient.
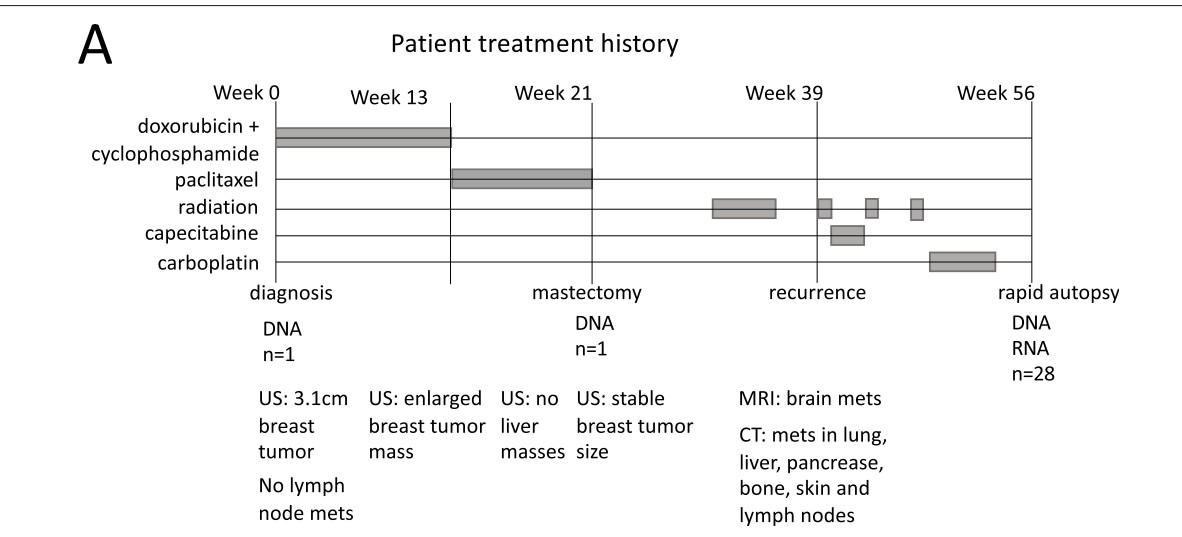
Patient history
Using a rapid autopsy and genetic sequencing of tumors that metastasized to multiple organs, Huang and colleagues map the clonal diversification of the primary tumor genome into tumors that emerged in different organs.
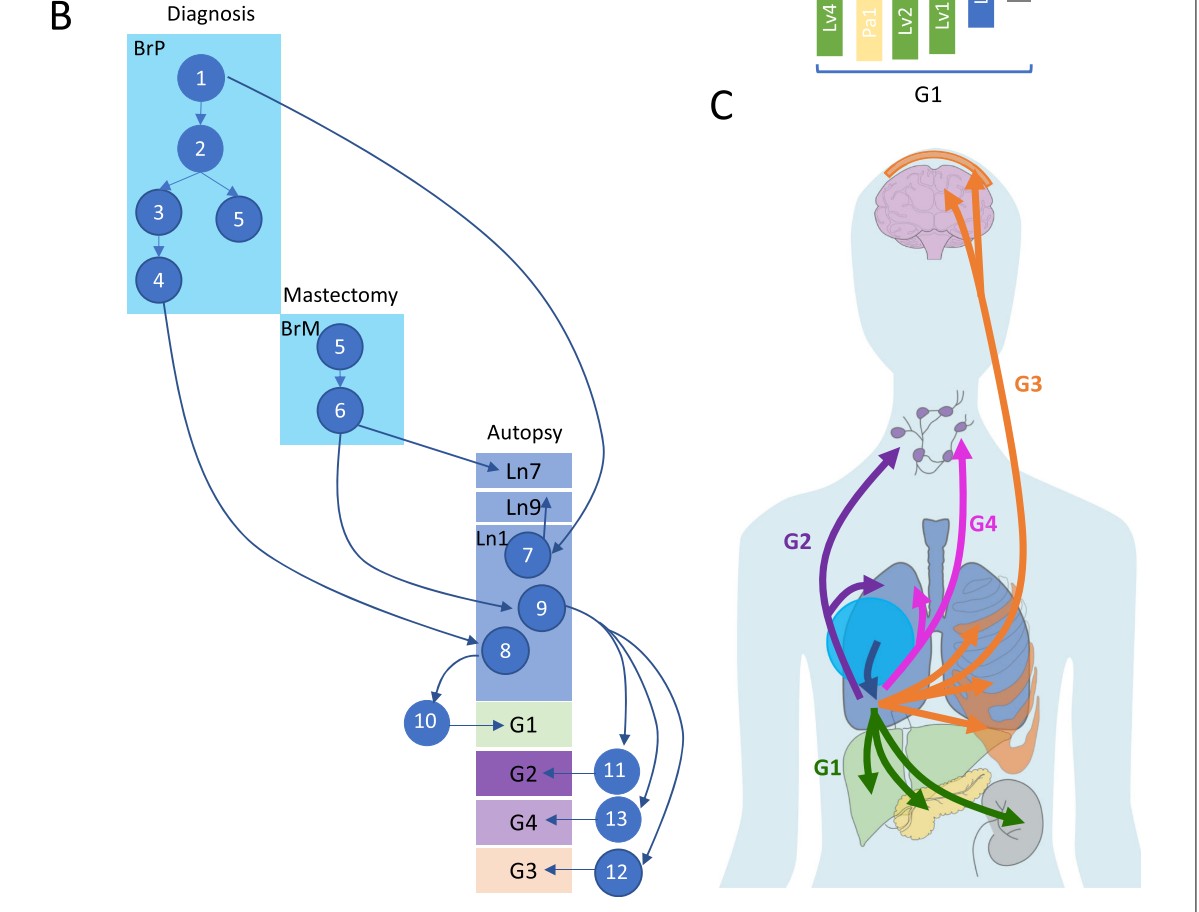
Evolutionary map
One of the elements with which this map of progressive metastasis was constructed is an analysis of copy number aberrations (CNAs). An interactive view of these CNAs in sampes from the 28 tumors in different body site is here.
