teachCovidData - overview
Vincent J. Carey, stvjc at channing.harvard.edu
January 07, 2023
Source:vignettes/teachCovidData.Rmd
teachCovidData.RmdBasic data resource
library(teachCovidData)
dat = usafacts_confirmed()
dat[1:5,1:6]
## countyFIPS County Name State StateFIPS 2020-01-22 2020-01-23
## 1 0 Statewide Unallocated AL 1 0 0
## 2 1001 Autauga County AL 1 0 0
## 3 1003 Baldwin County AL 1 0 0
## 4 1005 Barbour County AL 1 0 0
## 5 1007 Bibb County AL 1 0 0Examining new daily case counts by state
library(ggplot2)
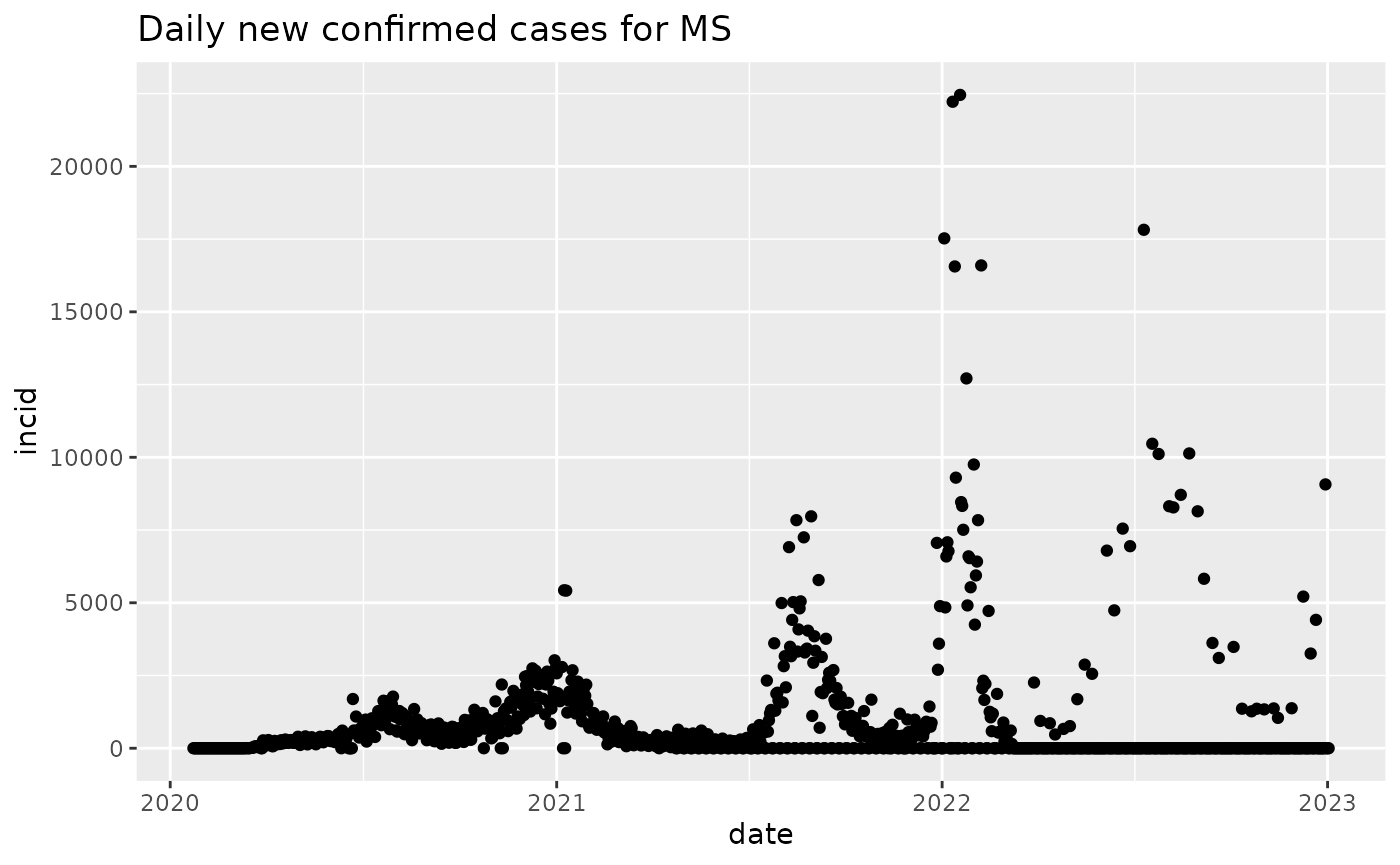
ncms = new_cases_state("MS")
plot(ncms)
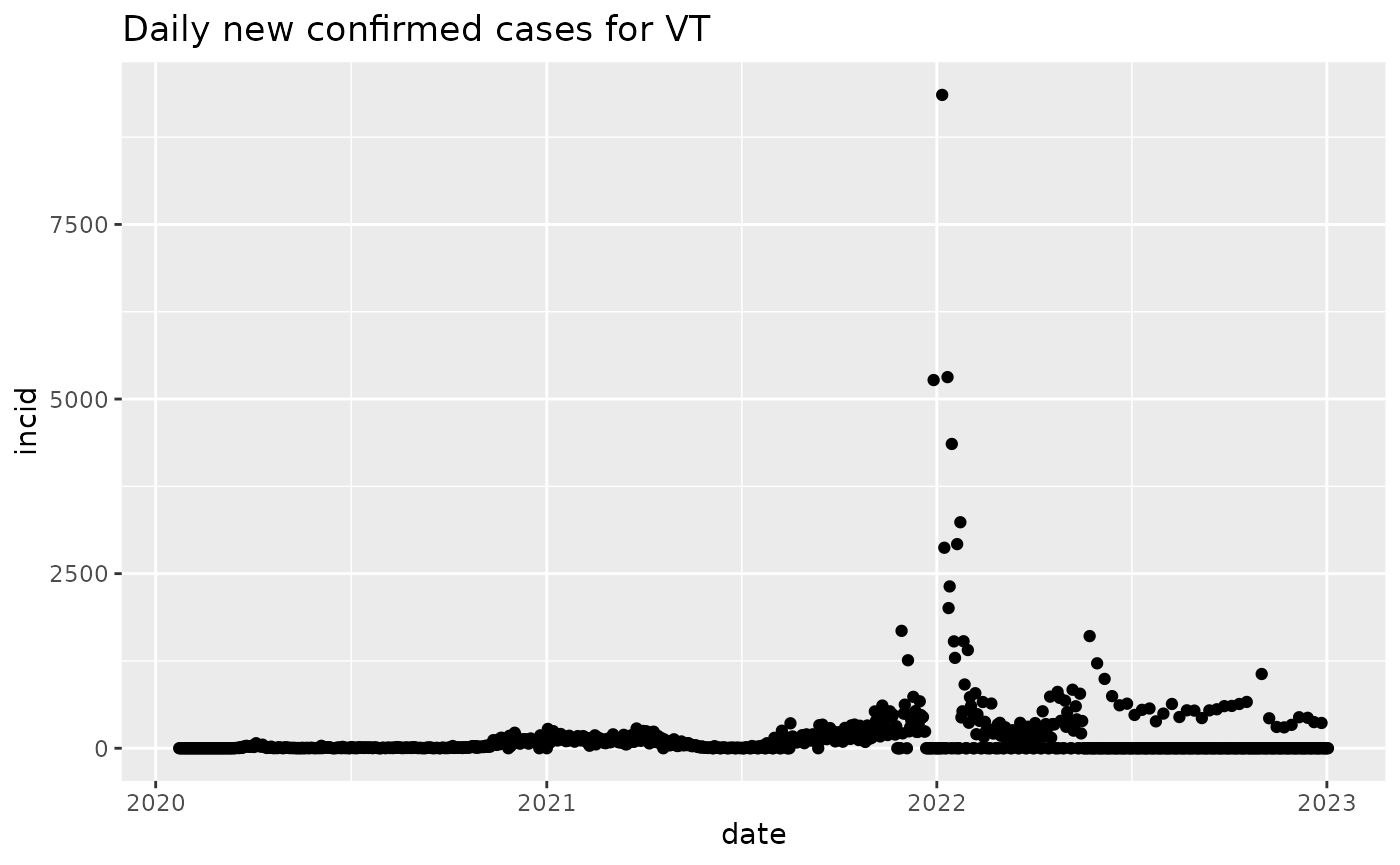
nn = new_cases_state("VT")
plot(nn)
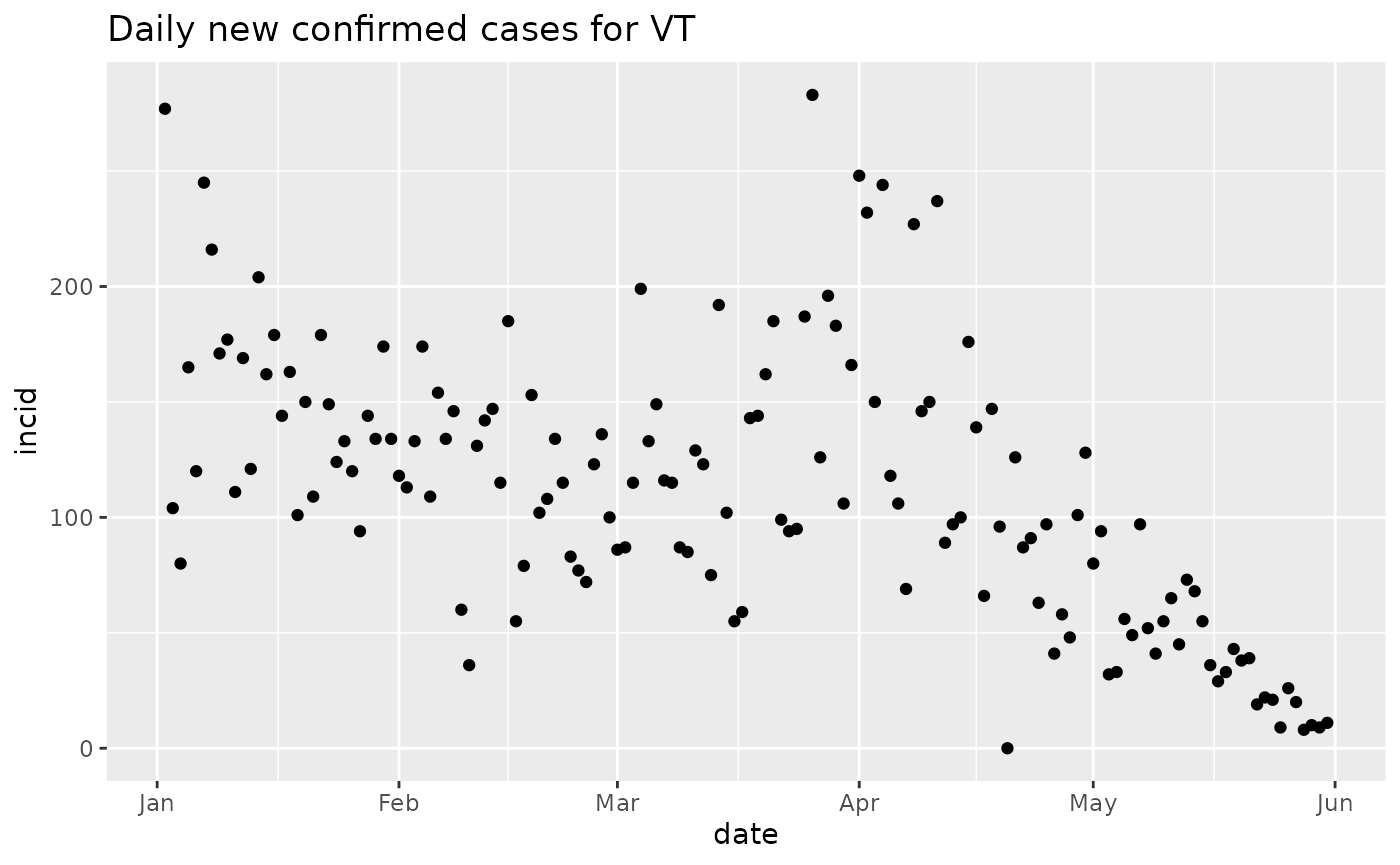
Use dplyr to filter by date.

Make the comparable plot for MS.